2018: Bigger than the GFC
Around 18 months ago we published an article titled, House prices drop: how it happens. It noted: “In a boom market, the two or three buyers chasing any one home are prepared to pay extra for tomorrow’s price rises. In a falling market, there can be only one buyer and one who wants to pay less than yesterday’s price.”
That 2017 insight sums up Sydney for 2018. And this week’s figures from CoreLogic’s home value index show this correction is unprecedented.
Sydney homes have got more affordable by 9.5% in 16 months. That’s just shy of the peak-to-tough dip of 9.6% set during recession of 1989 to 1991. And bigger than post-GFC slides when annual rates declined at 4.3% between 2010 and 2012.
An onslaught of media commentary has kept everyone’s expectations in check. But just when sellers and buyers seem to align on value, the market shifts gears again. And Sydney had another 1.4% decline in November.
On the front lines, plenty of examples bring wider speculation to life.
If tighter lending rules are playing a part, look no further than this apartment, which just sold for $192,000. In the past few years, unbridled demand would have driven that price up.
But at just 12sqm the pool of potential creditors was limited, investors were restricted, and first-homebuyers needed hefty savings. So that left people buying with big deposits or equity.
In recent years, “price feedback” was a common term but that became obsolete in 2018. Now, the only price feedback worth listening to comes on a signed contract, with a cheque, and certainty.
Genuine buyers are scarcer and auctions clearance rates are now hovering around 35% to 40%. The uptake on investor loans is the quietest we’ve ever seen, and owner-occupier loans are at their lowest levels in four years.
Energy and listing levels are coming to a close earlier than usual this year. That usually means the market is poised to start early.
That could see us with an initial surge of enthusiasm, or an oversupply of stock. But anyone predicting miracles is kidding you.
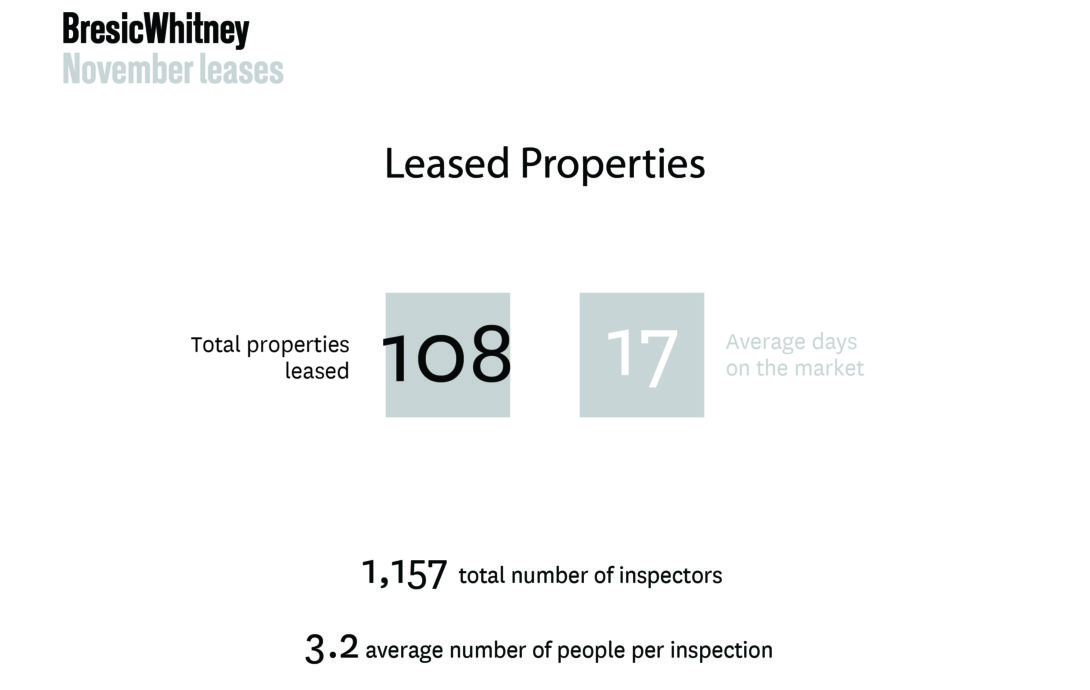
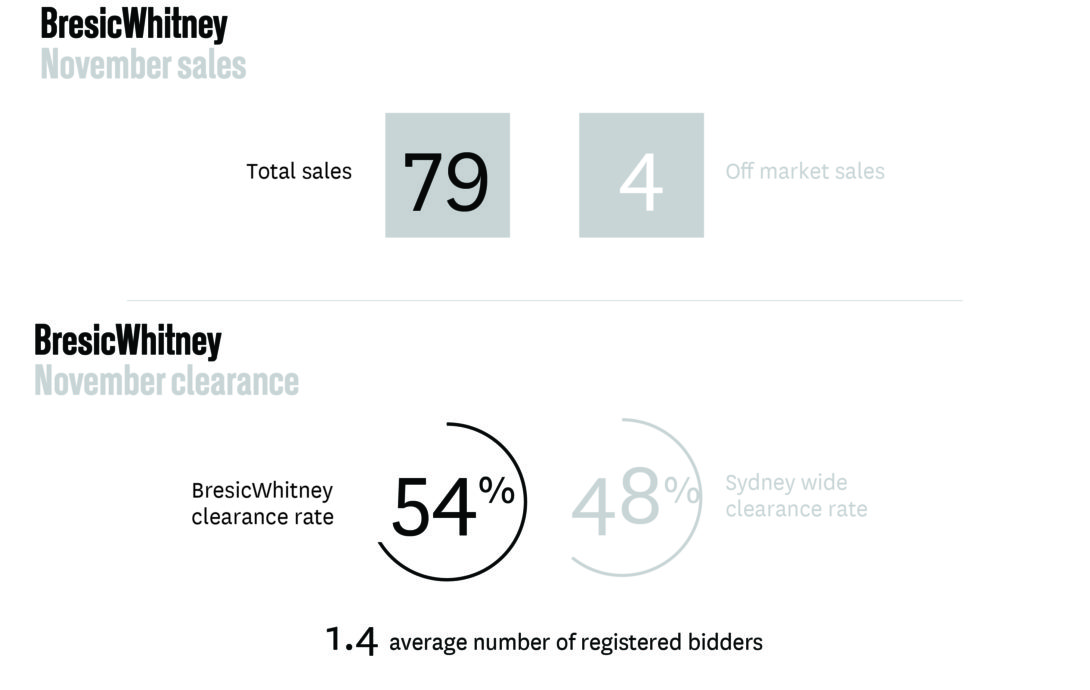
Our November stats are below.
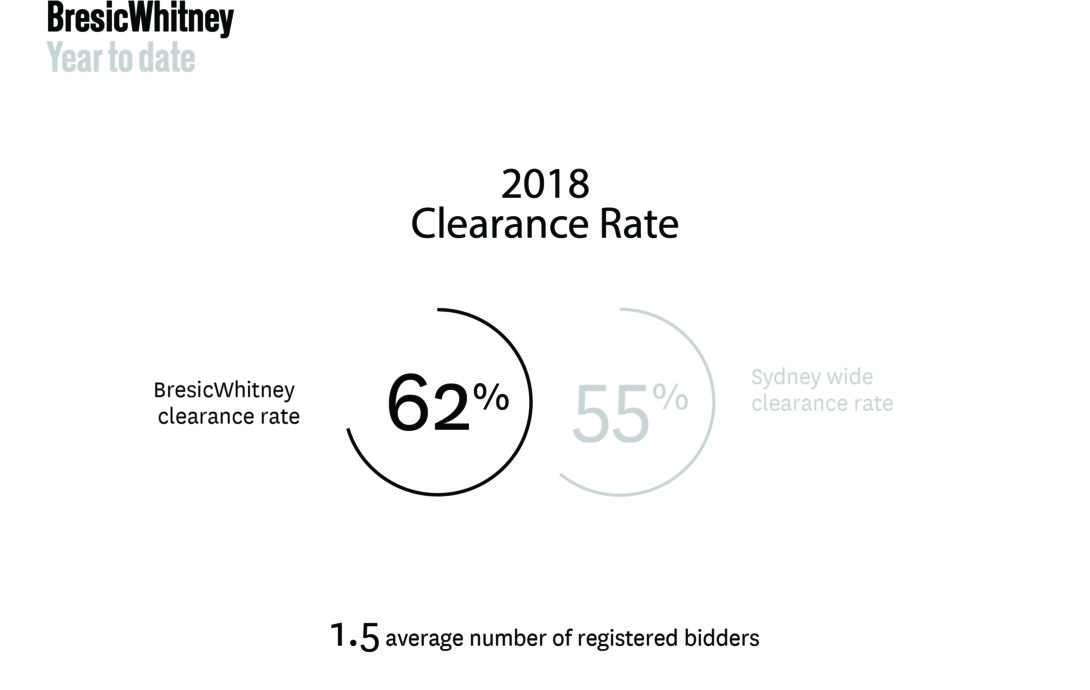
The BresicWhitney year-to-date clearance rate is 62% compared to the wider Sydney figure of 55%.
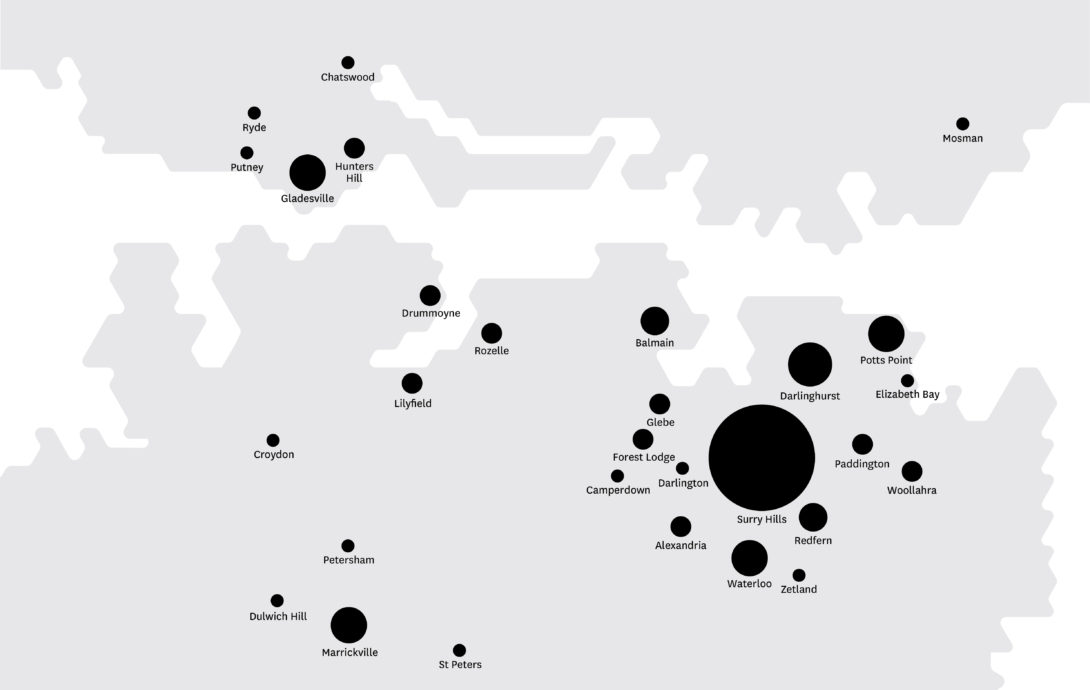
Sales activity was strongest around Surry Hills, Darlinghurst, Marrickville and Gladesville. And we saw multi-million listings and sales from Balmain to Hunters Hill.
The rental market continues to be challenging, inconsistent and hard for owners to comprehend.
Tenants have so many new homes from which to choose, that previously listings need to be perfectly clean for some wow. Price is a factor, and can no longer be gauged from neighbouring properties, or what was previously achieved.
Across spring, some properties went quickly, others took their time, and only the spotless and well presented drew a crowd.
